How do you make extreme weather risks understandable and actionable – without requiring a PhD in climate science?
For the team behind delta-climate™, the answer lies in design.
At its core, this web-based platform translates vast climate data into real-time visualizations and intuitive interactions, allowing users to assess the future of physical risks like floods or heatwaves with confidence. But this clarity didn’t happen by accident - it’s the result of a user-focused design process that simplified complexity and empowered decision-makers.
|
Simone Thompson
|
How design helped turn complexity into clarity
Structure: seeking clarity
One of the first challenges was: how do you make vast amounts of complex climate data – from floods and heatwaves to socioeconomic impact models – accessible for people who need to act on it?
Design played a central role in this. It helped us structure the platform in a way that aligns with how users naturally explore risks and assets. To guide users step-by-step, we developed three interconnected views:
- Exposure: a simple geographic overview of all assets
- Hazard: assessment of climate risks like heat or flooding
- Impact: understanding the financial consequences of those hazards


Methods: design for humans
From the very beginning, we used design methods that allowed us to stay close to real user needs – from climate scientists to project financiers. These included:
- Stakeholder interviews to understand expectations and constraints
- Competitive analysis to learn from global best practices, but also shortcomings in climate UX
- Hallway testing for quick feedback on usability with team members and neutral users
- Concept testing with potential clients to iterate and validate the MVP
This helped us understand what was missing in existing tools – and how our platform could stand out by being useful, not just informative.


Introducing delta-climate™
delta-climate™ is a web-based software as a service, designed for the on-the-fly assessment of physical climate risks in understanding the future impact of extreme weather events on infrastructure, supply chains, humans.
The platform was built leveraging the open-source globally renowned CLIMADA (CLIMate ADAptation) model, the result of over a decade of collaborative work. It allows seamless navigation between high-level and asset-specific views and presents complex outputs in a clear, actionable format – whilst the underlying methodology remains scientifically rigorous and transparent.
By integrating climate impact into investment and planning decisions, delta-climate™ helps businesses work with nature – not against it.
A real-world example
Alex, an operations manager with a large retail company, is mandated to expand their logistics network. His challenge: find two new warehouse locations with minimal physical climate risks.
By using delta-climate™, Alex can analyze potential sites using dynamic visualizations and interactive maps. He explores exposure to floods, hurricanes, and other extreme weather events, and identifies the safest locations to ensure supply chain resilience.
This example shows how good design, combined with robust data, enables better decisions in a world shaped by climate change.
Scope: design for user value
delta-climate™ is characterized by its intuitive dashboard and interactive features that bring clarity to climate complexity:
- Dynamic visualizations: Clear graphs and figures simplify complex risk data, enabling users to grasp complex information quickly. Visualizations update dynamically when parameters change.
- Interactive maps: These allow companies to explore their risk exposure over time, assess climate hazards, and analyze financial impacts.
- Intuitive navigation: Designed for professional use, the platform enables high efficiency and requires little to no training.
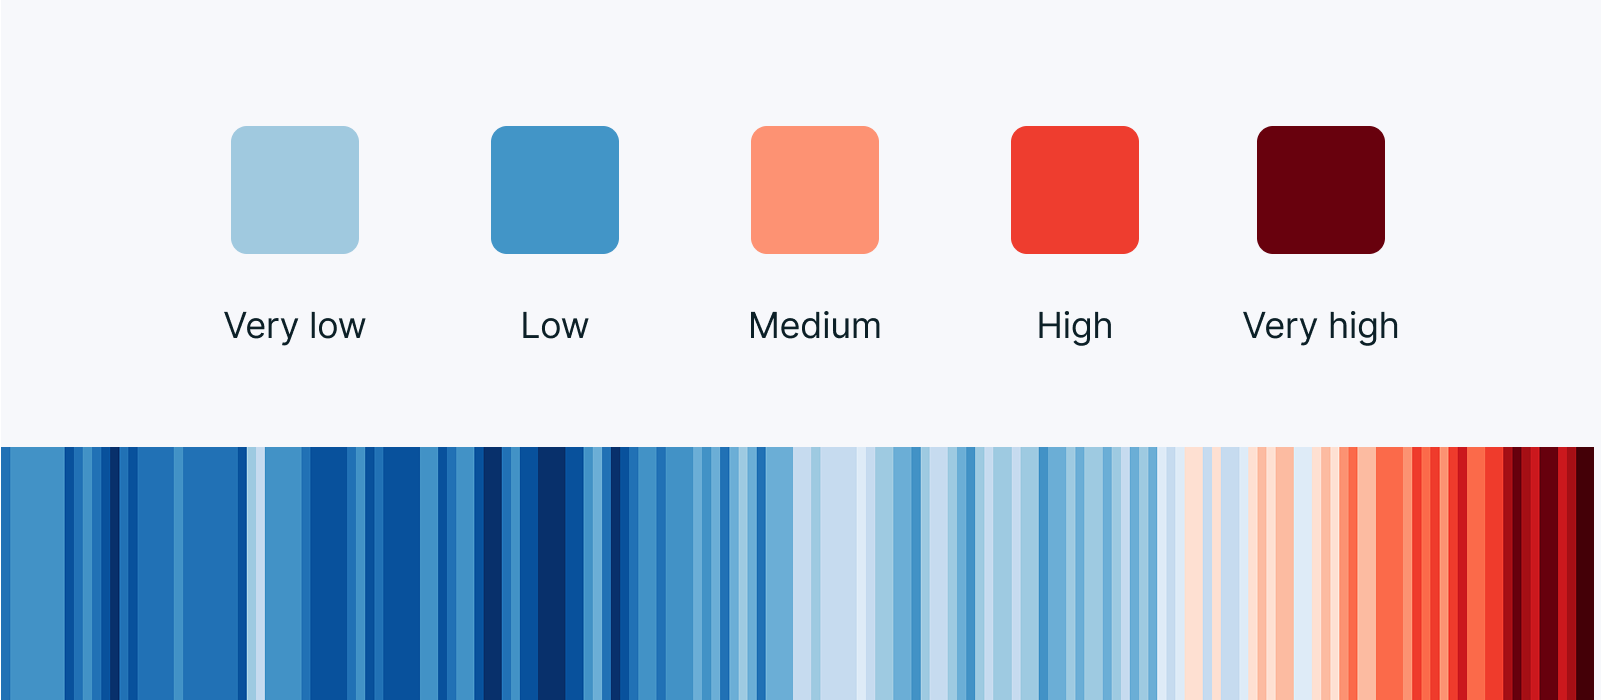
- Color coding: The use of color is very functional and deliberate. As an example, the rating of risks in hazard view consists of a set of colors, based on the iconic climate stripes by Ed Hawkins
A lean approach for fast iterations
delta-climate™ was a 0-to-1 product. We followed Lean UX principles for rapid experimentation, collaboration, and reducing waste – key factors for any platform development aiming to move fast and stay user-focused
It worked particularly well in three ways:
- Agile sprints (two-week cadence) helped us move from concept to MVP rapidly
- Close feedback loops with our target audience – including scientists, insurers, and financial risk managers – helped the product grow in the right direction.
- Team alignment: Lean UX integrated naturally into our agile development flow.
 We moved from sketches to usable tools quickly, without losing sight of quality.
Continuous improvement: iterating the details
Despite the targeted approach, as well as the experience and knowledge of the subject matter experts involved in the delta-climate™ development, there was room to gradually improve usability:
- Clearer risk symbols: At first, the down arrows implied that climate would recover and gave a wrong impression of the (global) situation. The design was thus changed to make the symbols clearer and scientifically correct.
- Accessible colors for everyone: The original color maps were hard to read for people with color vision deficiencies. After some quick user tests, the color scheme was improved.
- Marker variations: Data visualization and user comprehension were enhanced based on different tests of map markers.
- Consistent visual style: Visual elements like isobars were carefully adjusted to keep the overall look in line with the brand.


Understanding physical climate risks
While design is key to interaction, content remains essential to context.
Physical climate risk refers to potential damage and disruption to assets – such as buildings, infrastructure, or production facilities – caused by extreme weather events like floods, droughts, and wildfires. Unlike general climate risk, it’s focused on direct, tangible consequences.
The scale is global – and growing:
- 295 bln. USD/year needed by developing countries for adaptation (IPCC)
- 66% of global businesses have at least one high-risk physical asset (S&P Global)
- 313 bln. USD in damages from weather events in one year
Real-time climate risk assessment helps organizations and individuals:
- Risk mitigation: Identify and reduce impacts from floods, heatwaves, and other extreme weather events
- Enhanced resilience: Build adaptive capacity to withstand climate-related disruptions
- Strategic planning: Integrate climate data into long-term business and transition strategies, smart protection, and build of assets
- Financial reporting: Ensure transparent climate risk reporting for investors and regulators
- Legal compliance: Comply with evolving regulations on reporting physical and transition climate risks
Managing climate risk – thanks to technology and design
Climate change affects every business, government, and household. By visualizing physical climate risks with progressive design, the delta-climate™ platform renders them tangible, understandable, and calculable.
Good design helps turn data into insight – and insight into action. That’s what enables smarter adaptation strategies and the mitigation of climate risks to protect assets, businesses, economies, and societies.

Written by

Samuel Frischknecht
Head of User Experience

Anneline Cachat
Head of UX & BA Growth Markets